

stgatilov
-
Posts
6774 -
Joined
-
Last visited
-
Days Won
233
Everything posted by stgatilov
-
Christmas "Connections" Contest 2021 - [ Winner "Iris" ]
stgatilov replied to nbohr1more's topic in Fan Missions
Some time ago I also got excessive linebreaks on the forums, although in my case whole lines were never broken into pieces, just the newlines that I put became way longer. I could remove them after-the-fact by editing my post twice. In the end I noticed that I accidentally disabled javascript via browser extension. I enabled it back, and now everything works perfectly. -
TDM 2.09: Main menu corrupted with 64-bit Color Precision
stgatilov replied to zergrush's topic in TDM Tech Support
Yes, but given the age of GPU, it probably won't happen. Originally, the problem was narrowed thanks to this news: https://www.phoronix.com/scan.php?page=news_item&px=AMDGPU-FP16-DCE8-Patches&utm_source=feedburner&utm_medium=feed&utm_campaign=Feed%3A+Phoronix+(Phoronix) But it is not clear what happened with this patch, which drivers it affects, and whether it is about our problem or something else. -
TDM 2.09: Main menu corrupted with 64-bit Color Precision
stgatilov replied to zergrush's topic in TDM Tech Support
@Alberto Salvia Novella, crappy colors in menu is another bug, but this time rather surely of AMD driver. Series of old AMD GPUs don't support 64-bit colors, so you need to set "r_fboColorBits 32", or go to advanced tab of graphical settings and toggle Color Precision to 32. Unfortunately, we cannot do anything about it, because 1) GL 3.3 requires support of 64-bit color, and 2) the implementation should report unsupported formats via framebuffer incompleteness, and our code already checks for it and prints warning... but in this particular case the driver says everything is OK. There is no proper way to detect this problem. Well, I guess OpenAL decided to bump priority of its thread but your permissions don't allow that. I don't think it is a big issue, and I surely cannot do anything about it. Perhaps lack of flushing? We usually use either logFile cvar or condump command. -
Your screenshot shows revision 9540?
-
Yes, there was some bureaucratic mess related to deprecation during GL 3.0 and 3.1, which was finally resolved in GL 3.2. Like "deprecated but not removed yet" which later turned into "removed in core". It can easily explain it worked before version bump, but stopped working after it.
-
Now I can finally decipher the correct stack trace. Here is the list of commands which was necessary to achieve that: # note: all the .so files obtained from user machine must be put into local directory. # # most importantly, the following files are necessary: # 1. libthread_db.so.1 and libpthread.so.0: required for thread debugging. # 2. other .so files are required if they occur in call stack. # # these files must also be renamed exactly as the symlinks # i.e. libpthread-2.28.so should be renamed to libpthread.so.0 # load executable file file ./thedarkmod.x64 # force gdb to forget about local system! # load all .so files using local directory as root set sysroot . # drop dump-recorded paths to .so files # i.e. load ./libpthread.so.0 instead of ./lib/x86_64-linux-gnu/libpthread.so.0 set solib-search-path . # disable damn security protection set auto-load safe-path / # load core dump file core core.6487 # print stacktrace bt
-
Because they are more permissive. Maybe some popular game used CPU pointers in core profile, so drivers decided to support it. Anyway, it is a big error for core profile, and it must be fixed.
-
I think I fixed all calls in svn rev 9595. Here are executables from the latest SVN, most likely compatible with the latest dev build. It would be great if someone can verify that everything works properly now even with "r_glCoreProfile 2" (default).
-
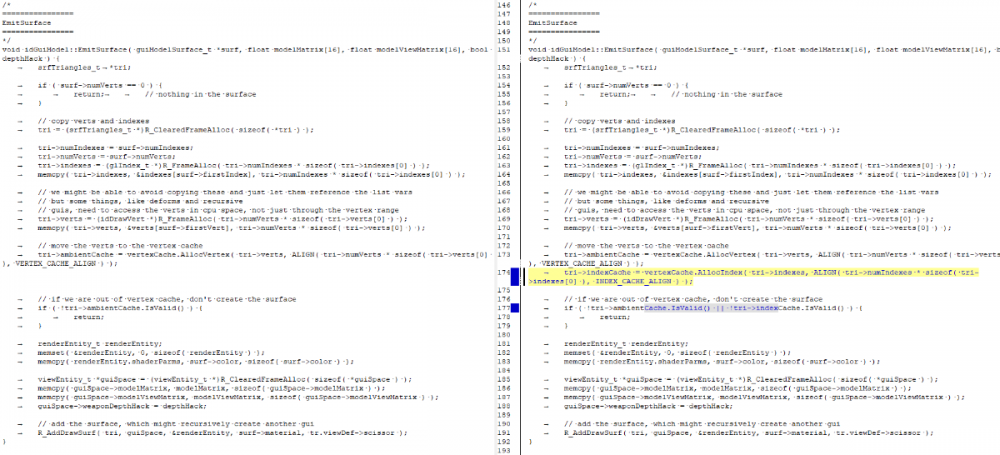
It seems that the easiest approach is going through all R_AddDrawSurf calls and adding the same thing everywhere. I wonder why R_AddDrawSurf does not create caches automatically inside... but I guess not the best time to refactor it.
-
I think this should fix it: But I still get draw surfaces with invalid indexCache durign gameplay as soon as "objective complete" text pops up.
-
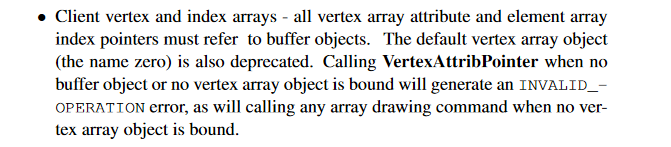
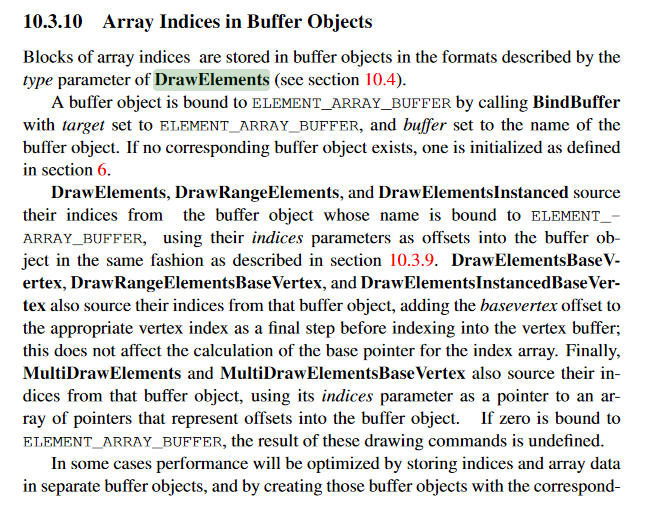
Citation from "E.2.2 Removed Features" in Core Specification:
-
Maybe this? And it seems that vertex attributes can only be specified with glVertexAttribPointer, which also seems to require offset into bound buffer object.
-
We never found what was the reason behind this issue. It broke after we started asking for GL 3.3 instead of GL 3.1, and it does not break in compatibility mode. I don't think it is easy to revert back to the old version, and not sure how to debug it either.
-
As far as I remember, TDM 2.09 requires OpenGL 3.3 to start. So either your OpenGL does not fit the requirement, or (as I guessed above) it has separate GL versions for core and deprecated profile. Perhaps version in core profile is newer than 3.3, but the version in deprecated profile is only 3.1 By the way, do you also have the problem with black screen in main menu and sound playing?
-
Christmas "Connections" Contest 2021 - [ Winner "Iris" ]
stgatilov replied to nbohr1more's topic in Fan Missions
Wow! Given that 2.10 beta testing will most likely start at the beginning of December... it would be a busy month -
Mmm... probably some Mesa-based open-source Linux drivers? Until recently, they did not support GL3+ with deprecated profile.
-
Then the same workaround should work: seta r_glCoreProfile "0" in darkmod.cfg It is a rather old graphics card, right?
-
I already gave debug symbols for the 2.09a release. They can be used for debugging, although doing it is not very obvious (optimizations make things messy). The source code for the latest release can be obtained from website: https://www.thedarkmod.com/sources/thedarkmod.2.09a.src.7z There is COMPILING.txt file inside, which explains how to build. It is pretty standard CMake build, so I guess you can edit CMakeLists.txt to disable optimization. P.S. Since I'll probably need to analyze other core dumps in future anyway, I'd be happy to try one more thing. @esme, could you please share your libc.so ?
-
I think you suffered a lot more than me to get to this point I'm disappointed if this comes to no end after so much effort. Yes, I'm surprised too. Do you know by any chance if your glibc was compiled with -fomit-frame-pointers ? One possible explanation is that your glibc build has no frame pointers (maybe all builds are done like this). I don't have debug symbols for it, so my gdb cannot push through glibc functions when doing stack trace (note that the crash happens inside free). You have debug information (I suppose it was installed with some of the packages, e.g. with gdb) of glibc, enough to make stack trace push through glibc functions and see TDM call stack. Anyway, I don't think it makes sense to fight with this mess. It's time to either forget about this problem until better circumstances, or try debugging over Skype or something like that (which would probably be lengthy and end nowhere too).
-
It did not help. I totally lost my faith in Linux core dumps. Also asked a question, maybe I'm doing something wrong: https://stackoverflow.com/questions/69189241/analyze-linux-core-dump-on-different-machine-threads-and-shared-libs
-
It seems that I also need libpthread.so.0.
-
Could you find libpthread_db.so.1 file on your machine and share it here? Pretty stupid thing of course, but I guess that's what I'll have to ask now from every user who creates a core dump
-
I see the same trash again. It turns out that in the damn Linux world, you cannot open core dump made on a machine with different glibc version if the program is multithreaded! At least that's how I understand the warning "Unable to find libthread_db matching inferior's thread library, thread debugging will not be available." I don't know how to fix that... to me it makes core dumps rather useless feature. I'm glad you have posted a stacktrace. At least I know where to look at.
-
I must admit I'm rather nooby in Linux development I looked into the dump, but could not get meaningful stack traces. It seems that TDM is killed by SIGABRT, and it seems that core dump contains state after handling the signal. This is quite strange because manuals say that gdb breaks on it by default. Maybe you could try again, but please execute "handle SIGABRT stop" in gdb before executing "run" ? Another approach is to get stack trace on your machine. Download debug symbols: get and unpack thedarkmod.x64.debug, put it just near thedarkmod.x64. Then run gdb ./thedarkmod.x64: you should see a message like this: Reading symbols from /mnt/hgfs/thedarkmod/darkmod_209/thedarkmod.x64.debug...done. Then execute "run" and reproduce the crash. After then execute "bt" in gdb: it should print meaningful stack trace. You can also switch between threads using "info threads" and "thread 1" / "thread 2" / ..., but I hope it won't be necessary.
-
Ehm... memory dumps are usually compressed very well. Just in case you submit another one