
stgatilov
-
Posts
6774 -
Joined
-
Last visited
-
Days Won
233
3 Followers


-
You can check if transform has no scaling (3x3 submatrix is orthogonal up to epsilon) and leave sound spawnargs "as is" in this case. I think that would make more sense than setting them on every movement.
-
I believe the engine sets mindistance = 1 and maxdistance = 10 if they are not set explicitly in the sound shader. At least that's what I see here: https://github.com/stgatilov/darkmod_src/blob/trunk/sound/snd_shader.cpp#L154 Anyway, if DR sets spawnargs to the same values as in sound shader, that's not a problem for the suggested change in the meaning of zero value. But setting maxdistance = 0 will be
-
But sound spawnargs are merely overrides. You should not set them at all if you don't intend to override the values set in sound shader. Also, how does moving anything affect sound distances? Whenever you move sound, you should only change its position/orientation and nothing else, shouldn't you?
-
Are you going to build two separate missions knowing that player will only see one of them? I think this is "cool in theory", but in reality using such a feature requires tremendous amount of work from mapper, so nobody will use it.
-
That is interesting question. I think no? In principle, I guess I can cover it as well. If I want to expose persistent info from mission as gui vars, I can as well copy some gui vars into persistent info before mission.
-
The new behavior is available in the latest dev17026-10712. If you set cvar s_overrideParmsMode to 1, then you get the new behavior. The old behavior is under value 0, which is default yet. Also there is "debug mode" if you set value to 2. In this case the new behavior is used, but console warnings are posted when a sound being started shows difference in behavior (i.e. the engine computes both behaviors and complains if they are different). Right now you'll see regular warnings about various AI sounds: they have wrong effective volume in TDM 2.12 and before due to this issue. As for modifying the missions, I think the main blocker is the new DarkRadiant behavior. @greebo @OrbWeaver, could you please comment why DR automatically sets s_minDistance and s_maxDistance spawnargs since recently?
-
The new behavior is available in the latest dev17026-10712. If you set cvar r_envmapBumpyBehavior to 1, then you get new behavior. The old behavior is for value 0, which is default yet. The missions/core files are not adjusted yet. But I'd say everything is ready to do it.
-
In the latest dev17026-10712, GUI debriefing is supported. It works exactly the same way as GUI briefing. It would be great if someone tries it For the nearest future, I'd like to support passing information from game script to GUI debriefing. So that you could show different things in debriefing depending on what player did in the mission.
-
dev17026-10712 is available!
-
TDM 2.12 DestroyDelay console warning when checking objectives
stgatilov replied to grodenglaive's topic in TDM Tech Support
Yes, this is a bug. In svn rev 17012 I fixed this warning in case player closes objectives with anything but Escape button.- 1 reply
-
- 1
-

-
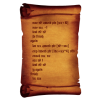
I tried the script on the core assets, and find an interesting case called textures/darkmod/metal/flat/tiling_1d/gen_smooth_gold01 This material has time-dependent envmap color: { blend add maskalpha cubeMap env/gen1 red sintable[time*0.1] green sintable[time*0.1] blue sintable[time*0.1] texgen reflect } I wonder whether it was intentional or not. Here is how it looks: I suppose it would be worthwhile to manually review the modified materials, because in some cases the color adjustment was actually meaningful...
-
If you did not delete the contents of the directory where you installed TDM with tdm_installer, all the log files should be there. Their filenames are suffixed with data&time, so they can only be removed manually. If you find them, you can just share all of them, I'll find the error in the logs.
-
Yes, this behavior of DR would become a big problem after this change. Because all sound sources will be efficiently muted... Meanwhile, I think most of the maps were created before this behavior. So other opinions on setting zero sound spawnargs are welcome.
-
I have DR 3.0.0. (I rarely update it since I rarely use it)
-
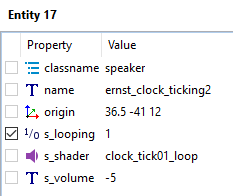
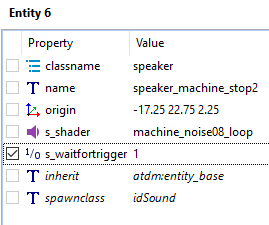
I imported them into DR, still don't see any s_xxxDistance spawnargs there: