Search the Community
Showing results for 'black screen' in content posted in TDM Tech Support.
-
I'm confused. You're using triple buffering because you have vertical sync disabled and you don't want 'as much' screen tearing? Has nothing to do with FXAA working or not. When you say, forcing triple buffering in Nv CP doesn't work, what do you mean exactly? ...and....welcome to the forums!
-

Linux distro. advice: need to output via YPbPr
_Atti_ replied to Bikerdude's topic in TDM Tech Support
Is everything ok with your cables? I once had purple/pink hued screen and it was because of bad cable. In linux have you tried setting the same resolution as windows lets you to see if the problem persists? you can set custom resolution/refreshrate : http://askubuntu.com/questions/377937/how-to-set-a-custom-resolution -
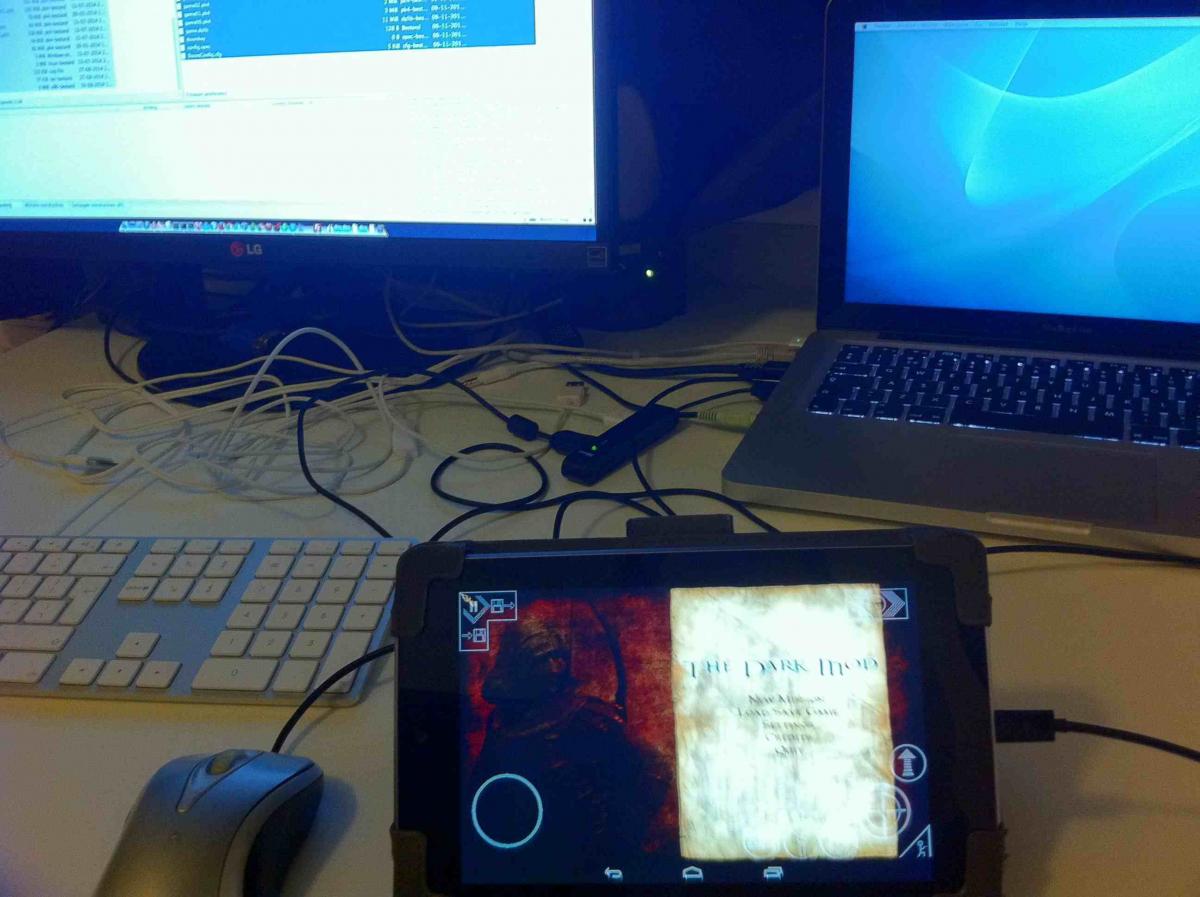
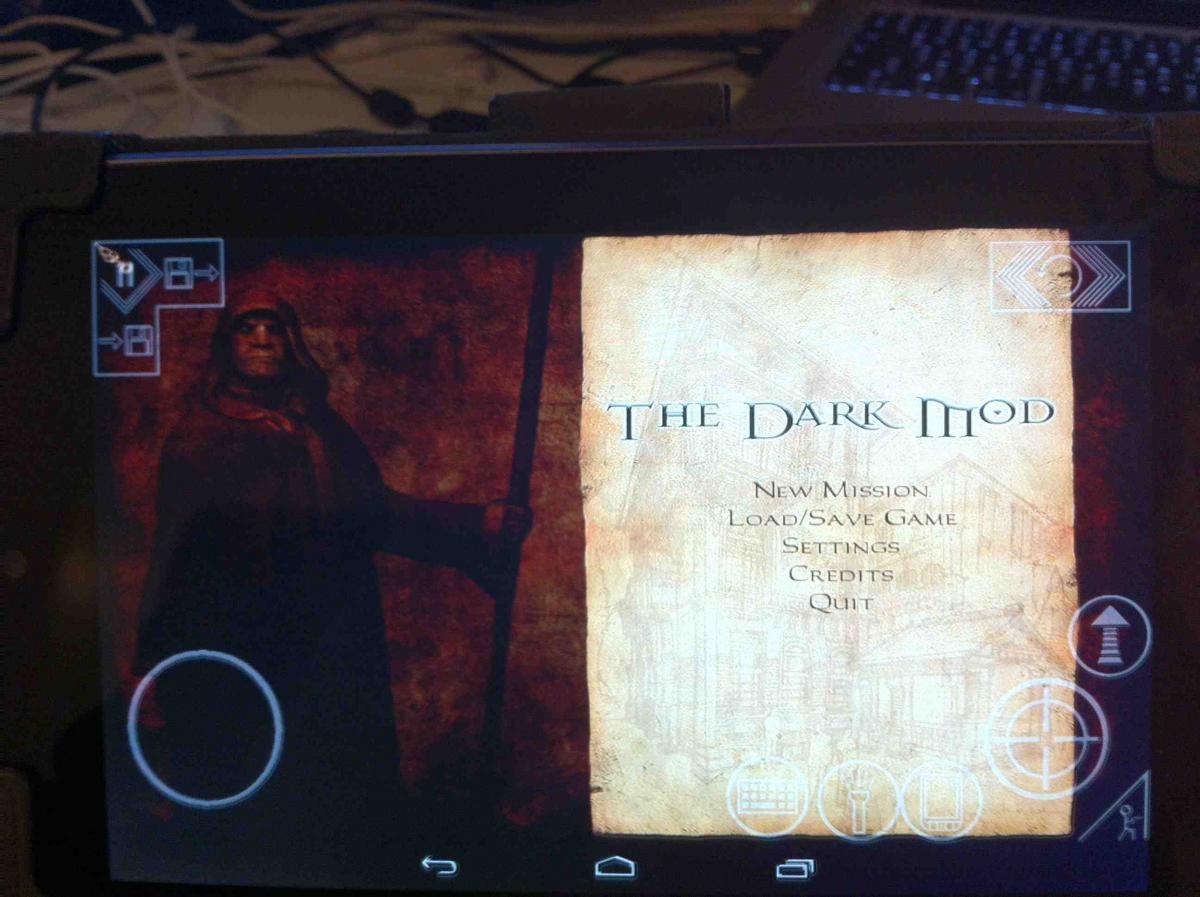
I'm trying to run TDM on my android tablet (nexus 7, first edition, android 4.4.2). This is a topic to give you some instructions and status. I hope you can help me to fix several problems. Its not meant to change the development direction to change the standalone to a mod. Its just for fun! Installation: Install android app "DIII4a". Copy the "base"-folder (from doom 3) and the darkmod-folder (version 2.02) to the DIII4a folder on the sdcard. Run DIIII4a with the default settings. In doom 3, select the game in the mod section and load it. (its possible that the select-sound will loop) A loading screen (old watch) appears and at the bottom of this screen some error codes wil be displayed. Wait for a few seconds. You hear a Beeping sound and the TDM menu apears. TIP: Add the keyboard button to the DIII4A interface. Add Bind "l" "com_allowConsole 1" to doomcfg.cfg. In game hit, push the keyboard button, push the "l" and then the tilde-button for the console. Bugs/status: Got the interface running, but doesnt hear the background music and serveral menu-sounds belongs to D3. I dont see the trainingsmission in the "new mission" section. It cant also download the mission list. See the spoiler for the log

-
I don't believe UV alignment region shifts are applicable to models but it is well known in the black art of "brush carving" that change the texture alignment slightly will cause dmap to split tris and correspondingly split draws when rendered. This is a boon in cases where you don't want a surface to be hit by too many light passes but obviously a problem where texture alignment is changed for artistic reasons and there's no rendering reason why new draws should be generated. I'm still looking for more CPU skinning engines in the wild. From what I can see, there's a few more out there than I originally reckoned but the examples thus far are mired in proprietary Intel SSE dependencies.
-
I've tried gDebugger now and I'm loving it I didn't come up with anything majorly interesting from my cpu profiling. The lightgem render passes take up a surprising amount of time -- more than drawing the screen -- but they have a job to do that's just as complicated as drawing the screen, i.e. working out much light falls on a 3d object (the player) taking into account all the (potentially moving) shadows in the vicinity. But we might be able to save some cpu time there now that we have access to the engine by allowing those passes to share some results with one another and the screen draw. Not necessarily though: the list of shadows that can be cast on the player isn't the same as the list of shadows that the player can see, and the engine already caches results for future render passes. I found that turning off that code makes 10fps difference in outdoor areas that are currently 30fps for me, so it's worth a look. Also, our buffer->image captures are eating about 8% of cpu time. Not the new depth capture: thats only 0.4% -- but the original ones to _currentRender. Worth checking whether FBOs can cut that down. The redundant glColor calls were nowhere to be seen in my profile reports. I used a sampling method to start with, while running about in some highly detailed maps and capturing the function that was occupying the CPU every one millionth clock cycle. Evidently, at the CPU end, those functions are so fast that they were never in the frame, not even once, when the snapshot got taken. So CPU effect is negligible. I haven't tried to work out yet whether they're having a deleterious effect on the GPU. I tried to use VS2013 pro's instrumentation method instead to capture their timings (it injects logging code into every function call, so you never miss any call no matter how fast it returns), but I got 0.5fps after the code injections and gave up the attempt. Using gDebugger for the first time was an illuminating experience. I set it to do one-draw-per-click and to draw into the front buffer instead of the back buffer so I got to see the map drawn one draw call at a time. There were a couple of surprising results just from that exercise: bits of objects that I'd expect to see drawn in a single call were taking multiple calls, and identical models with same texture, size, and alignment were not drawn in one call as I thought they'd be. Plenty of calls sent only about 6 verts to the GPU. The text on the wooden signposts in that water shader test map I committed (prefab entity GUIs) were drawn in several calls per sign, some of the calls painting only a single letter. Obviously we need to look at a lot more examples, but there could well be room for taking out some draw calls there. Exciting stuff. I couldn't get it to show me buffers or textures from the GPU memory though: it hangs if I try. I have an AMD GPU so I went on to try AMD's version "OpenXL" but although I could see the buffers and textures, its interface with VS2013 is so disruptive and horrible that I uninstalled it. It kills menus before you get a chance to click on them and I couldn't get it to display the performance counters at all. Has anyone got that working? Likewise AMD's GPU PerfStudio. I can start up TDM in the server ok but the program hangs when I try to hook up the client. Can anyone with a bit of experience in these tools help me out? In the meantime I'll go back to the bits of gDebugger that are working for me. NB: the % cpu time results above were from a debug build. The effect on the release build that people actually use to play the game would be around half that, because the debug build slows down the cpu stuff while leaving the gpu driver code running at full speed, so it skews the relative timings in the cpu direction.
-
Thanks Bloomquest, what screen resolution are you running?
-
Did some testing and I stand corrected. I took some screenshots clearly showing the AA effect and what I found is, you can not change a video setting and have it applied without completely restarting the game. Restarting the level will not apply the new settings. The game must be completely reloaded for the new setting to take effect. I tried turning off AA>0 in game and forcing it in the driver and there is a difference although, at least on a 780gtx, its not discernible and the fact that no matter what the game caps your FPS @60 its hard to tell what performance impact is occuring. I did notice though with 0xAA selected in the driver and Vertical sync OFF in game along with forced off in the driver, on the loading screen FPS went up to the 1000FPS cap. With 32xCSAA +8x Supersample, the FPS on the loading screen only went up to 255. So the difference is there and it is substantial but with such an old title if its being rendered >80fps no matter what settings are applied (screenshot FPS fluctuates between 78-80) then its hard to actually see the performance difference. Nvidia has always had superior OpenGL performance but for newish ATI cards to be getting 20FPS in this game sure does seem like something is broken considering the load on the video card is quite small. I hope they figure out what it is. I recall running Crysis at 2xAA and FPS being around 50ish FPS at the time and trying to run 8x brought the FPS down in to the 8-15FPS range. Every game I've ever played always exhibited this behavior so I suppose when I first played through Doom 3, I never even tried higher levels because of what I knew about AA in every other game. The old "elephant and the string" adage. Thanks for the lesson! It would be interesting as per motosep's comment, to turn off hardware rendering and run a test only using software rendering on each of the affected systems just to get an idea of what each of the systems CPU's is contributing to the mix. See if there is any correlation. It definitely seems like the video card is not correctly handling what the CPU is handing off to it. Sorry to be off topic, Biker, we can't delete posts that I'm aware of but feel free.
-
Not necessarily. If the rendering pipeline isn't limited by fillrate then adding/removing extra pixels to be rendered won't make much difference to performance. This is also why lowering your screen resolution won't necessarily speed up the rendering of a badly-performing game. What part of "AMD confirmed an issue with their drivers" do you not understand? Or do you think AMD engineers are so stupid that they can't diagnose problems in their own drivers and need the benefit of your theorycrafting and random guesswork about what the Doom 3 engine "couldn't possibly" be doing?
-
FPS: 47 System: Radeon 7870 2gb, Core I7 2600k, 8gb ddr3-1600, Gigabyte p67 mobo, Win7 SP1 Catalyst version: 14.4 Screen resolution: 4320x900 AAx0, AFx1, Vsync Off, Ambient render and Interact shader Enhanced
-
So I did it. TDM died when loading training missing with profiler evaluating the engine. Then I just ran profiler when it was already loaded. That was CPU profiling with Very Sleepy. It wasn't as bad as I thought at first. Next step was running gDebugger. And that was horrible See results here: https://drive.google...Rjg&usp=sharing Oh, and that was with the same set up I used before for AMD fix thread: System -- Nvidia GeForce 670 GTX 2Gb, AMD Penom x3 2.2Ghz, 8Gb DDR, xfx 750a, Sound: Asus Xonar D1, Win 7 Pro 64bit Driver -- Nvidia's latest release Screen res -- 1920x1200 Settings -- AAx8 ASx8, VSync off
-
Unless something else earlier in the pipeline is causing a bottleneck, leaving the shading stages with time to spare? That might also explain why I could put 60 dust fog billboards on screen and toggle them between hardware depth testing and my programmed soft particle shader without seeing a change in fps.
-
I suspect people just automatically set all graphics settings to max if they have a reasonably modern card, and don't bother conducting tests to see what effect each setting has on performance. Agreed. There's not much that can be learned from people's results using totally different graphics settings and screen resolutions, even if they all have AMD graphics cards.
-
This thread was moved from: http://forums.thedarkmod.com/topic/16628-opengl-perf-on-amdati-gpus-wip-fix/ in case anyone is wondering how any of the below text relates. ==================================================================================================== I personally can not comprehend why many of the posters are running AAx8, especially at 1920x1080. The difference between 4x > 6x > 8x at that resolution is hardly discernible particularly when you're actually moving around playing and not just staring at the screen looking for visual nuances. As motosep also said, it "murders" performance. The memory requirements from 4xAA > 8x are doubled and the amount of calculations the GPU has to do is also increased substantially. If you exceed the physical memory limitations of your card, how can it keep up? Playing at 1920x1200 I've never seen a substantial visual gain going over 4x and I just don't understand why so many people run 8xAA. The *only noticeable benefit is less FPS and that's not a benefit. So why do so many people run 8xAA? I guess you can just set everything to High/Max and live with the amount of FPS you get but why would you do that when you could be running >60FPS and have a much smoother experience. Also, if we're actually performing a study of FPS vs. GPU/CPU reqs, shouldn't we have a controlled case where by everyone with dissimilar hardware runs all of the exact same settings to get a baseline of performance data? (e.g. 0xAA 8xAF Shadows on MED/HIGH, Textures on MED/HIGH, etc.) Then maybe have a second case with all of the exact same settings with everything on higher settings to help determine if there is some other bottleneck or constraint affecting various cards/systems.
-
Fps ~34 (with "preferred maximum performance") System -- Nvidia GeForce 670 GTX 2Gb, AMD Penom x3 2.2Ghz, 8Gb DDR, xfx 750a, Sound: Asus Xonar D1, Win 7 Pro 64bit Driver -- Nvidia's latest release Screen res -- 1920x1200 Settings -- AAx8 ASx8, VSync off Note, Nvidia. As I said, it's not all AMD. It's also engine being CPU bound.
-
Fps -- 43 System -- Radeon HD7800 4gb, core i7-3820, 16gb DDR3 1600MHz, Asus P9X79 pro intel x79, Sound ??? (maybe onboard?), Win7 Home sp1 Driver -- Catalyst 14.9 default settings Screen res -- 1920x1080 Settings -- AAx8 ASx16, VSync off, Ambient rendering enhanced, Interaction shader enhanced Thanks from me too Biker!!
-
Here you go: FPS: 39 System: Radeon R9 280, Intel Core i5-3750k 3.40Ghz, 8gb DDR3-1666, Asrock H61M-HVS, Windows 7 Home Premium Driver: Catalyst 14.9 w/stock settings Screen resolution: 1920 x 1080 Settings: AAx8, ASx16, V-Sync Off, Ambient Rendering-enhanced & Interaction shader-enhanced Also thanks for looking into this.
-
Fps - 20 System - Radeon HD5650, Aspire 5552G-P544G32Mnkk, Athlon II P340, 4Gb DDR3, Ubuntu 12.04.5 Driver - Catalyst 14.9, w/stock settings Screen res - 1366*768 Settings - AAx8 & ASx16, VSYNC-on, Ambient Rendering-enhanced & Interaction shader-enhanced
-
Fps - 29 System - Radeon HD7850, Core 2 Duo E8400, 4Gb DDR2-800, Gigabyte GA-EP45 DS3, Sound Blaster Audigy, Win7 Ultimate x64 Driver - Catalyst 14.9, w/stock settings Screen res - 1920*1200 Settings - AAx8 & ASx16, VSYNC-on, Ambient Rendering-enhanced & Interaction shader-enhanced Additionally i made an interesting observation: my minimum fps in that area were 19 and when i turned off aa the minfps changed to 14, which absolutely makes no sense to me.
-
Crossfire presents other issues in and of itself as I'm sure you're aware. If you run the game in windowed mode it should only use your primary card by itself though that may present separate issues from full-screen mode.
-
I suspect it is shorthand for "Eliminates screen tearing if you can't be bothered to implement proper vertical sync yourself and would rather rely on the compositing window manager to do it for you with a (presumably) horrible performance cost".
-
Yeah, "Eliminates screen tearing", doesn't belong in their list. I also wouldn't say, "no risk of crashes or freezes". Reduced is probably a better word there. As far as I know, there is no SLI/Crossfire setup that supports it. If its not a fullscreen app, only 1 video card is being used.
-
I was talking with Bikerdude over skype after he'd remoted in and fixed an issue, and a thought popped into my mind. He directed me to the forums to suggest this feature. I hope this is the right subforum for suggestions. If it isn't move it. How about Borderless Window mode? When you have the game windowed with no window border, covering your whole screen. This allows for increased performance in some cases, as well as easy alt tabbing - which even in fullscreen mode doesnt work with TDM. What do you all think? TDM needs borderless window mode in my opinion. When I hear a steam message or a skype call, I have to save and exit the game, interrupting everything and having to reboot it. It's really slow and inelegant. And considering how long the missions are, I sometimes have to do so multiple times. I'd much rather do it fast and easy with Borderless winodow, without having to hassle through alt tabbing and exiting the game and restarting it and such.
-

Mission not ticking off the mission list when completed
gnartsch replied to esme's topic in TDM Tech Support
Thanks for the hint, Florian! Yeah indeed the issue is always on the same line. Both in the old bug and in this new report. http://forums.thedarkmod.com/topic/14251-mission-loading-screen-bug-with-finished-mark/ And I see the same if I drop a few missions so that a mission which should have a checkmark gets moved to line #11. And the phantom check marks also appear on that specific line. Pretty weird. I hope Tels recalls the fix. I suspect that his fix got lost at some point. -

Mission not ticking off the mission list when completed
esme replied to esme's topic in TDM Tech Support
missions.tdminfo the darkmod/fms/penny/savegames folder has a Mission_1_Final_save.save, .tga & .txt I reloaded the save, the loadin screen shows the mission has been completed but the tick isn't there full size version I loaded the final save I took before the game finished, all objectives except the "return to start" are ticked off Full size version Ran tdm_update ( log file ) just in case, this updated the training mission and tears of saint lucia, checked the mission selection screen and PD1 still isn't ticked off despite saying it's complete, however the stray tick on the last page seems to have disappeared. I'll try a complete fresh install of TDM just in case there's a corrupt file & get back to you -

Mission not ticking off the mission list when completed
Lux replied to esme's topic in TDM Tech Support
I think this is an idividual FM issue. From memory, I played through "The Heart of Lone Salvation" and although I tossed the heart in the proper place and heard the sound that indicated the heart wAS placed, the mission objective didn't check off (its fixed now I believe) and so on finishing the mission, the title screen showed the mission as unchecked even though I completed it. The FM didn't tell Missions page backend that the mission was completed. Because it only happens with certain FMs, I think it has to do with the objectives in the individual FM and how they're handled once the mission is complete. If the FM doesn't resolve the objectives correctly then the Missions page can't reflect accuracy either. I could be wrong though, wouldn't be the first time